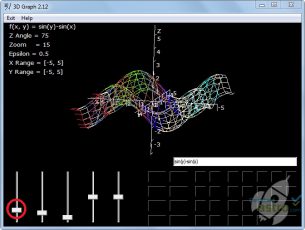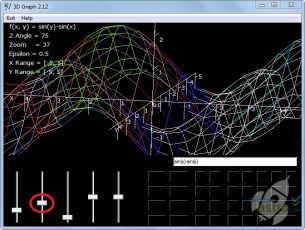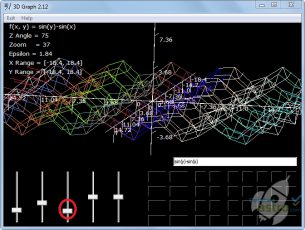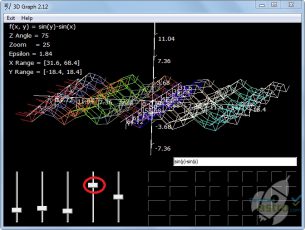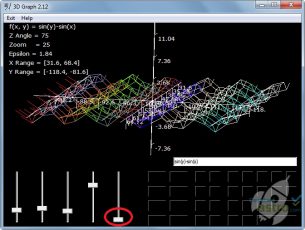
Explaining mathematical equations pictorially instead of orally is a wise idea and 3D Graph is the ideal way to do so. Once you specify the values in the equation which is of the form z=f(x, y), the software will come up with a three dimensional graph which clearly explains the relationship between the values of the equation.
Esittää matemaattiset yhtälöt graafisessa muodossa